
A reference guide for solution preparation
Peptide net charge, isoelectric point and pH.
A peptide’s net charge changes with pH, and it is the first clue to how the peptide will behave in solution. Before reconstituting a peptide to prepare a stock solution for an assay, count its charges. This guide works through the count on a published sequence, explains the isoelectric point and why calculators disagree about it, and covers measuring and adjusting pH in small volumes and what happens to buffers as they freeze.
For laboratory research use only. Not for human or veterinary use.
In this guide
How do you count a peptide’s net charge?
Suppliers count charges with a short rule: each acidic or basic group scores −1 or +1, histidine depends on the pH, and the sum is the net charge.
The supplier rule scores each group like this:
- Basic groups: +1 for each lysine (K) and arginine (R), and +1 for a free N-terminal amine.
- Acidic groups: −1 for each aspartic acid (D) and glutamic acid (E), and −1 for a free C-terminal carboxyl.
- Histidine (H): +1 below about pH 6, and 0 above it.
The ends count. A free N-terminal amine and a free C-terminal carboxyl are charged groups like any side chain, and supplier guides say both ends have to be taken into consideration. A blocked end removes its charge from the count, so read the end groups on the certificate before you start.
The count matters because, in general, the more charged residues a peptide carries, the more soluble it is in aqueous solutions. That is why it comes before the choice of a first solvent.
It is a quick estimate, not a measurement. It gives a whole number at one pH, treats every group as independent of its neighbours, and considers only free ends and the 20 standard amino acids and their D-forms. A histidine near pH 6, or an end group near its pKa, is only partly charged.
Worked example: the net charge of BPC-157 at pH 7
BPC-157 is the 15-residue sequence GEPPPGKPADDAGLV. The molecular mass listed for it in the GPC compound library, 1419.56 g/mol, matches the unmodified chain, so this example assumes a free N-terminal amine and a free C-terminal acid.
The lot certificate governs. If a certificate states other end groups, the count below changes with them.
The N-terminus and one lysine give +2; one glutamic acid, two aspartic acids and the C-terminus give −4. The sequence contains no histidine, arginine, cysteine or tyrosine, so these six groups are the whole count.
Calculated with 16 published pKa sets instead of the whole-number rule, the net charge at pH 7 ranges from −2.00 to −2.35, so the simple count and the full calculation agree.
Blocked ends change the count. A C-terminal amide removes the −1 and leaves a net charge of −1 at pH 7; an N-terminal acetyl group removes the +1 and leaves −3.
- N-terminal amine
- +1
- Lysine, position 7
- +1
- Glutamic acid, position 2
- −1
- Aspartic acid, positions 10 and 11
- −1 each, −2 in total
- C-terminal carboxyl
- −1
- Net charge at pH 7
- −2, from six ionizable groups across 15 residues
What is the isoelectric point of a peptide?
The isoelectric point, or pI, is the pH at which a peptide’s net charge is zero.
Below the pI the net charge is positive, and above it the net charge is negative. A count at one pH gives one point; repeating the calculation across the pH scale gives a charge–pH curve, and the pI is where that curve crosses zero.
For BPC-157 with free ends, the computed curve runs from +2 at low pH, where the N-terminus and the lysine are charged and all four carboxyls are neutral, to −4 at high pH, where all four carboxyls are charged and both amines are neutral.
Between those plateaus, using the EMBOSS pKa values, the charge is about +1.5 at pH 3, crosses zero at pH 3.88, reaches about −1.7 at pH 5 and holds near −2 from about pH 6 to 7.5, before the N-terminal amine starts to lose its charge.
The 16 published pKa sets place the pI of BPC-157 between 3.61 and 4.15. The curve is a calculation, not a measurement, and it is not a solubility curve: it shows how many charges the molecule carries at each pH, and nothing about how much of it will dissolve.
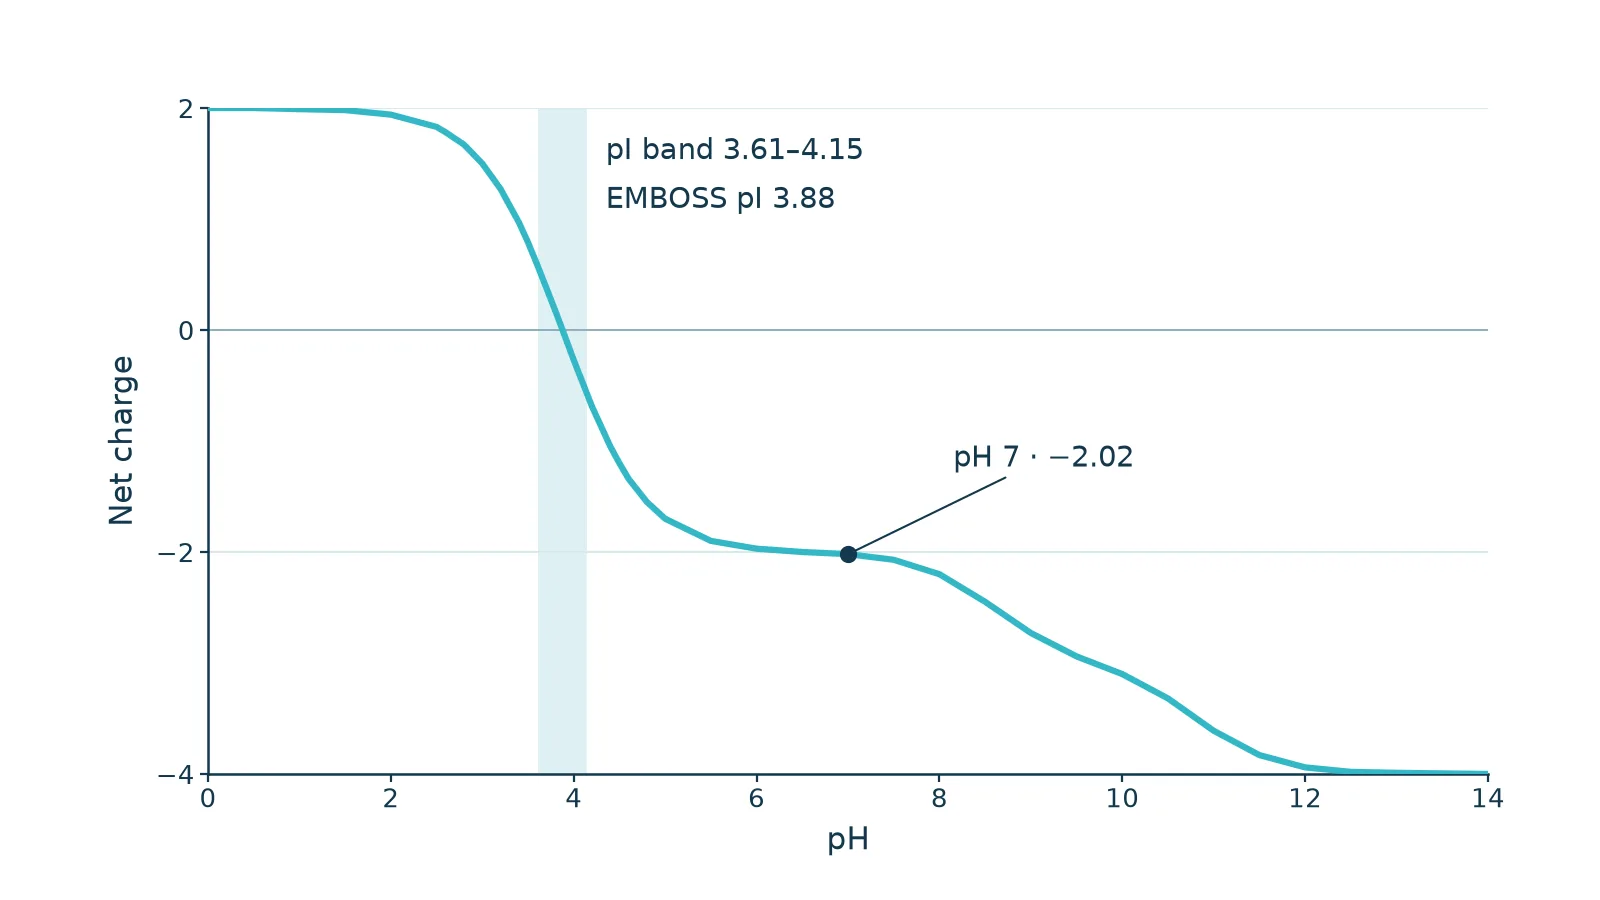
- EMBOSS 3.88; published-set band 3.61–4.15.
- Net charge −2.02.
Computed charge data
| pH | Net charge · EMBOSS |
|---|---|
| 0.0 | +2.00 |
| 1.0 | +1.99 |
| 2.0 | +1.94 |
| 2.5 | +1.83 |
| 3.0 | +1.50 |
| 3.5 | +0.79 |
| 3.6 | +0.59 |
| 3.7 | +0.38 |
| 3.8 | +0.17 |
| 3.9 | −0.05 |
| 4.0 | −0.27 |
| 4.2 | −0.69 |
| 4.5 | −1.20 |
| 5.0 | −1.70 |
| 6.0 | −1.97 |
| 7.0 | −2.02 |
| 8.0 | −2.20 |
| 9.0 | −2.73 |
| 10.0 | −3.10 |
| 11.0 | −3.61 |
| 12.0 | −3.94 |
| 13.0 | −3.99 |
| 14.0 | −4.00 |
Why is solubility often lowest near the pI?
With no net charge, molecules repel each other least and tend to form aggregates, so the pI is often, though not always, the point of lowest solubility.
Net charge also bears on aggregation: in general, the lower the net charge, the greater the tendency to aggregate. Near the pI, amorphous aggregates have been observed instead of fibrils.
In a classic protein study, the pH of minimum solubility followed the pI, lay within 1 pH unit of it, and solubility rose markedly on both sides. For one of the proteins, solubility was 2.2 mg/mL at pH 3.6, close to its pI of 3.5, and 23.3 mg/mL at pH 5.4: about tenfold higher, 1.9 pH units away.
The practical direction follows: move the pH away from the pI. For an acidic peptide, with a pI below 7, raise the pH; for a basic one, with a pI above 7, lower it.
How far to move has no fixed answer. A published 40-residue peptide with a pI of 5.2 did not dissolve at pH 7, 1.8 pH units above its pI, but did dissolve at pH 9. Treat the direction as the rule, and find the working distance with a solubility test on a small portion, within the pH range your method tolerates.
These figures describe one protein and one peptide from the literature. They illustrate the pattern; they are not values for any other sequence.
Why do predicted pI values disagree?
A calculated pI is an estimate built on assumptions. Each tool makes its own, so the same sequence can return several answers.
Every group is treated as independent
Calculators assume that each group ionizes on its own, with no electrostatic interaction from its neighbours. The whole-number count rests on it too.
Each tool uses its own values
The pKa values behind each calculator were derived empirically, at different temperatures and ionic strengths; the Bjellqvist set used by ExPASy comes from gel migration in 9.2 M and 9.8 M urea. Across published sets, the N-terminal pKa alone ranges from 7.26 to 9.69.
Short peptides feel their termini most
In a short chain the two ends carry a large share of all the charge. A published comparison of pI calculators found that, on peptides, most of the disagreement between methods came from the terminal groups.
3.61 to 4.15 from 16 published sets
Run through 16 published pKa sets, BPC-157 with free ends gives a pI from 3.61 to 4.15, with a median of 3.84. ExPASy returns 4.03 and EMBOSS 3.88.
Quote a range, not a decimal
In a published comparison on peptides with measured pI values, the typical error was about 0.25 pH units for the best set and 0.669 for Bjellqvist. ExPASy also warns that small molecules with little buffering capacity are predicted less reliably.
Solubility prediction is rougher still
One peptide calculator calls its own water-solubility estimate very rough and says solubility must be determined by experiment. Suppliers test a small portion before dissolving a whole sample, and at least one publishes lot-specific solubility data.
How do you measure pH in 50 to 200 µL?
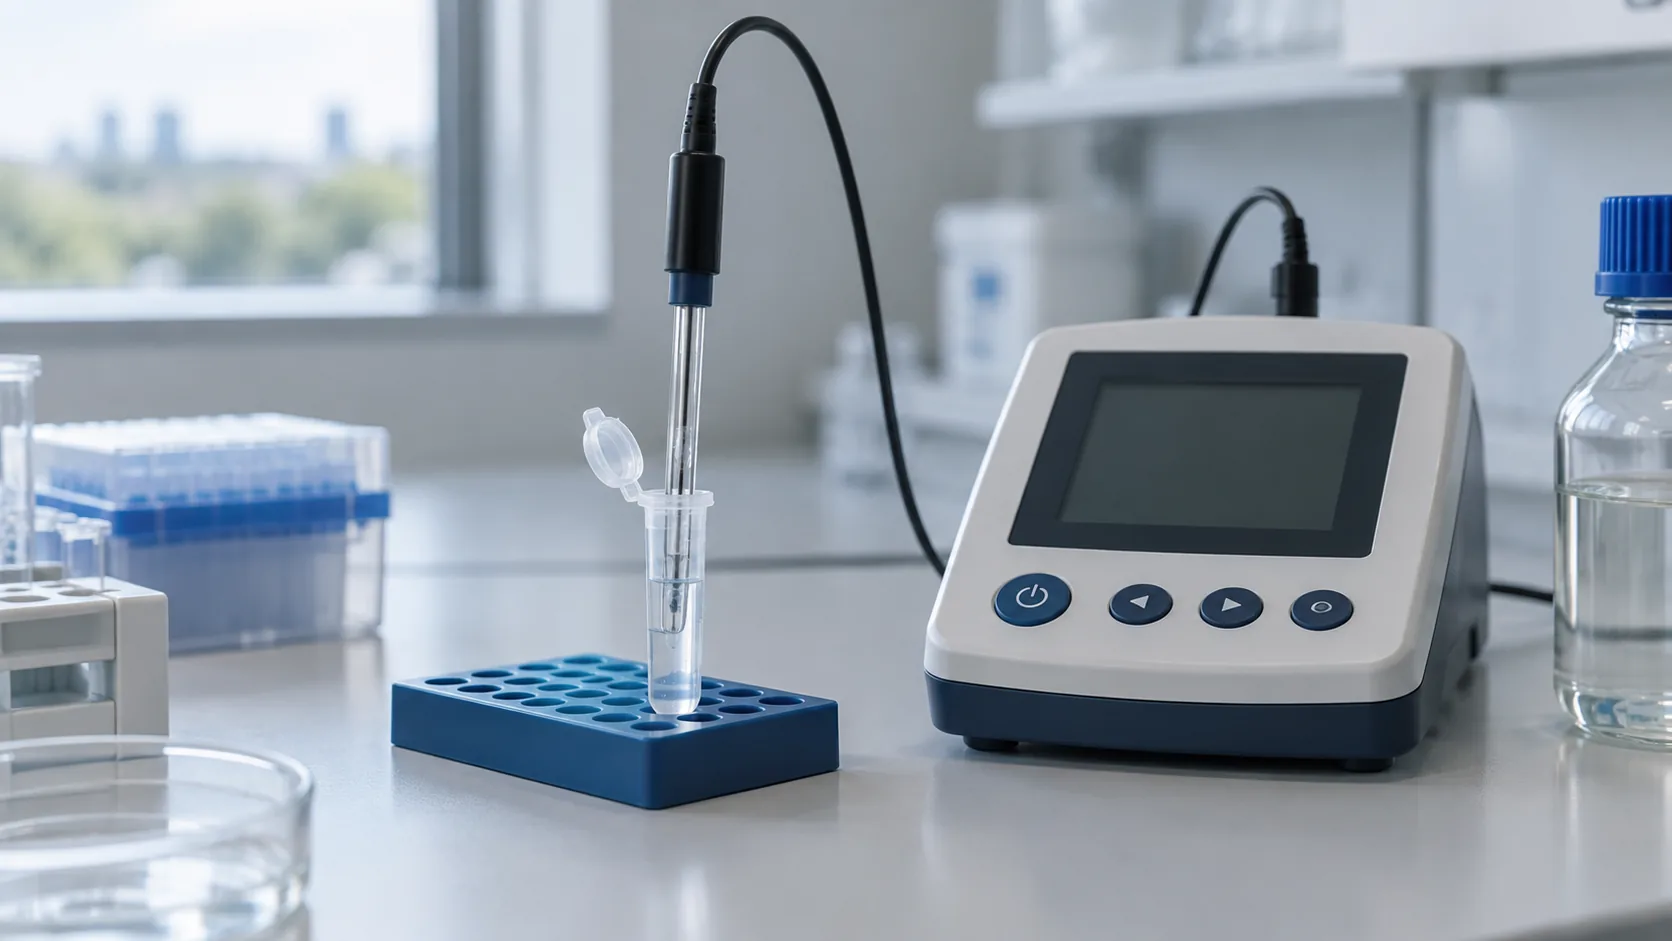
A small stock solution leaves little to spare, so the method has to fit the volume. A micro electrode gives a reading; indicator paper answers a coarser question.
- 01
Choose an electrode made for the volume
Micro pH electrodes with a 3 mm tip are specified for about 100 µL, and specialist micro probes go down to 15 µL. Narrow designs fit microcentrifuge and NMR tubes, and flat-membrane electrodes read a sample too small to cover an ordinary tip.
- 02
Cover the reference junction
The electrode reads correctly only when its reference junction is fully submerged, so check the depth it needs before deciding how large a portion to measure.
- 03
Measure a separate portion
Reference electrolyte flows out of the electrode into whatever it touches. Measure a portion set aside for the purpose, and do not return it to the stock afterwards.
- 04
Mix, then read
Mix the portion before reading so that it is homogeneous. In a microcentrifuge tube, gentle pipetting does this.
- 05
Clean the electrode afterwards
Peptides and proteins can precipitate in a ceramic reference junction and clog it. Open-junction designs exist for this reason, and one manufacturer’s guide cleans a clogged junction for several hours in 5% pepsin in 0.1 mol/L hydrochloric acid.
- 06
For a coarse check, spot a drop onto indicator paper
Indicator paper resolves only 0.2 to 1 pH units: enough for a coarse question such as whether the solution is below pH 4, which is how manufacturer methods for peptide samples use it. With a clean pipette tip, touch a small drop, about a microlitre, to the indicator zone and discard that portion. Never dip a strip into the stock: ordinary papers can release dye, and in a weakly buffered peptide solution the indicator itself can shift the pH.
How do you adjust pH in a small volume without overshooting?
Supplier guides expect the pH to be checked and corrected after an acidic or basic first solvent. In 100 µL, the hard part is not moving the pH but stopping where you meant to.
- 01
Measure before you adjust
The counter-ion and any leftover acid set the starting pH as much as the sequence does. HPLC-purified peptides usually arrive as trifluoroacetate (TFA) salts, and trifluoroacetic acid is a far stronger acid than acetic acid, with a pKa of 0.52 against 4.76. Read the pH first and adjust from the value you find.
- 02
Expect almost no buffering near neutral pH
A peptide dissolved in water buffers only weakly. Take the worked sequence as a model: a 1 mg/mL solution of it would be 0.704 mM, and with no histidine the only group that can take up acid or base between about pH 5 and 8 is the N-terminal amine. Its calculated buffer capacity at pH 6 to 7 is 0.03 to 0.06 mM per pH unit, against 1.8 mM at pH 4.
- 03
Use a dilute acid or base
In a model calculation of 100 µL of that solution at pH 6.0, with the peptide as the only buffer, 1 µL of a 1 M strong base takes the pH to about 11.9. The same 1 µL at 100 mM reaches about 10.2, at 10 mM about 7.7, and at 1 mM about 6.2; 1 µL of a 1 M strong acid gives about pH 2.1.
- 04
Add in small steps and read again
Add the acid or base in steps of 1 µL or less, mix gently, and read the pH again before the next addition. Adjust the pH in small steps toward the value your method needs.
- 05
Raise the pH gently
One peptide supplier advises using only very weak bases to raise the pH, to avoid racemization. Sequences with a free cysteine carry a second cost: thiol groups oxidize rapidly to disulfides above pH 7.
- 06
Record every addition
Every addition dilutes the stock: 5 µL added to 100 µL lowers the concentration by 4.8%. Record the acid or base, its concentration, the total volume added and the final reading, and correct the stock concentration for the added volume.
Model calculation: the buffer capacity and pH values in this section assume ideal behaviour, use the EMBOSS pKa values and treat the peptide as the only buffer. They show the scale of the problem, not readings to expect. A counter-ion such as acetate, with a pKa of 4.76, would add buffering between about pH 4 and 5.5.
What happens to buffer pH when a solution freezes?
A buffer that holds its pH at room temperature can move a long way as it freezes. For a stock solution that will be frozen, the choice of buffer matters as much as the pH you set.
The pH falls as disodium phosphate crystallizes
As ice forms, disodium phosphate crystallizes out and the pH drops abruptly. Starting at pH 7.4, 50 and 100 mM sodium phosphate reached pH 4.2 at −10 °C, and 8 mM reached 5.2. Starting at pH 5.7, the shift was smaller, to 5.1 and 4.7 for 8 and 100 mM.
A shift of about 4 pH units
Without other solutes, PBS shifted by about 4 pH units on freezing, for the same reason. Trehalose prevented the buffer salt from crystallizing, and mannitol partly suppressed it, reducing the shift.
Smaller shifts, mostly upward
Between +25 and −30 °C, histidine, acetate, citrate and succinate buffers shifted upward by less than 1 pH unit, while Tris rose by about 1.2 pH units. Potassium phosphate is used in place of sodium phosphate to minimize the drop on freezing.
A risk to control, not a certain loss
The shifts come from changes in pKa with temperature, solubility limits, eutectic crystallization and freeze concentration. A shift is a risk, not proof of damage: in one study of an antibody solution, aggregation depended on whether a non-crystallizing cryoprotectant was present, not on the pH change.
Sources: Gómez, Pikal and Rodríguez-Hornedo (2001) for sodium phosphate; Thorat and Suryanarayanan (2019) for PBS; Kolhe, Amend and Singh (2010) for the other buffers.
Common questions about peptide charge and pH.
What is a peptide’s net charge at pH 7?
Add +1 for each lysine, arginine and free N-terminal amine, and −1 for each aspartic acid, glutamic acid and free C-terminal carboxyl; histidine counts +1 only below about pH 6. For BPC-157 with free ends, the sum is −2. Blocked ends change the count, so check the end groups on the certificate first.
What is the pI, and why is solubility often lowest there?
The pI is the pH at which the net charge is zero. With no net charge, molecules repel each other least, so the pI is often the point of lowest solubility. In a classic protein study, the minimum lay within 1 pH unit of the pI.
How far from the pI should a solution be?
Move away from the pI: raise the pH for an acidic sequence and lower it for a basic one. No fixed distance is reliable, so find it with a solubility test on a small portion, within the pH range your method tolerates.
Why do pI calculators give different answers?
Each tool assumes that every group ionizes independently and uses its own pKa table, measured under its own conditions. For short peptides, the end groups cause most of the spread. Quote a range rather than a single decimal.
Is pH paper good enough for a peptide solution?
For a coarse question, such as whether a solution is below pH 4, yes. Paper resolves only 0.2 to 1 pH units, and in a weakly buffered solution the indicator itself can shift the reading. Spot a small drop with a clean pipette tip, and never dip a strip into the stock.
Which buffer suits a stock solution that will be frozen?
Avoid sodium phosphate and PBS where you can: as they freeze, disodium phosphate crystallizes and the pH can fall from 7.4 to about 4.2. Histidine, acetate, citrate and succinate shift by less than 1 pH unit, and potassium phosphate avoids the large drop.